I look for structure in the relations between things, not in the things themselves.
Ledgers as graph networks.
Sound as geometry.
Cities as overlay maps.
Human figures as 40,000 interdependent nodes.
Koji Sato, writing as Renpoo Tsukioka. Data analyst and visualiser, 3DCG rigger,
and essayist in Kawasaki, Japan. Native Japanese; English at professional working proficiency in reading and
writing technical material, conversational in speech.
What you can hire me for: data analysis and visualisation, Japanese-language evaluation and
post-editing of AI output, technical writing in Japanese, and research support. Remote contract work,
up to 32 hours a week.
Current work
Tensor-Link Utility (2026–)
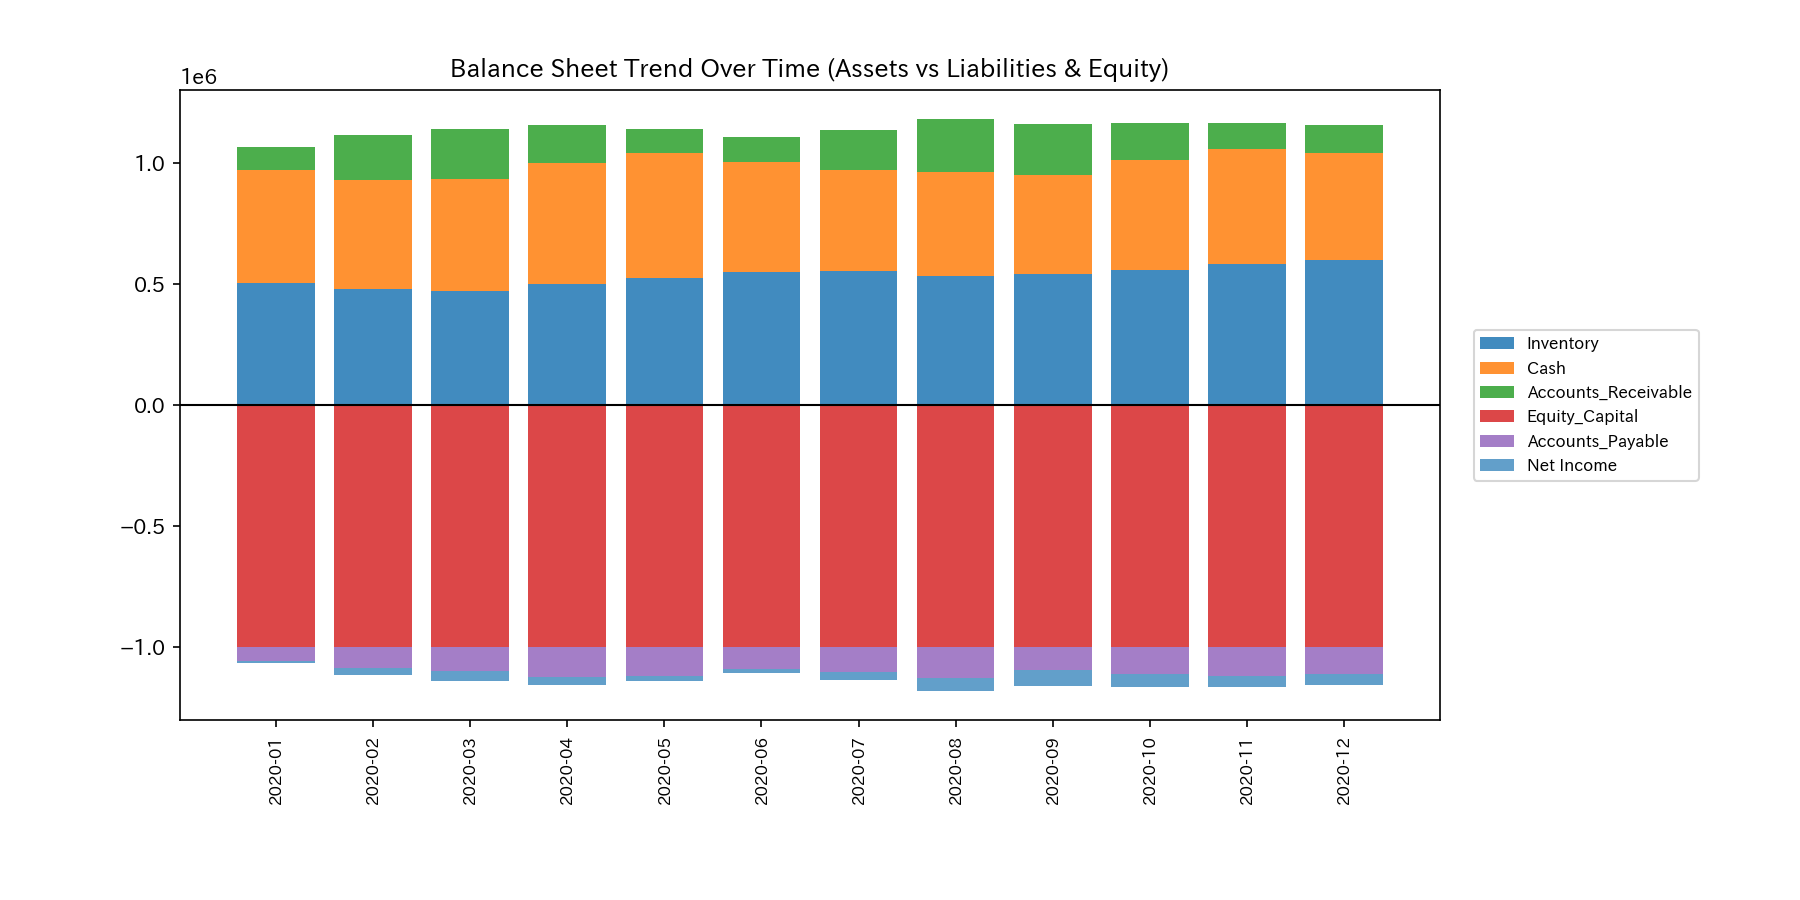
1. What a financial statement shows. Twelve months of a synthetic company as a stacked balance
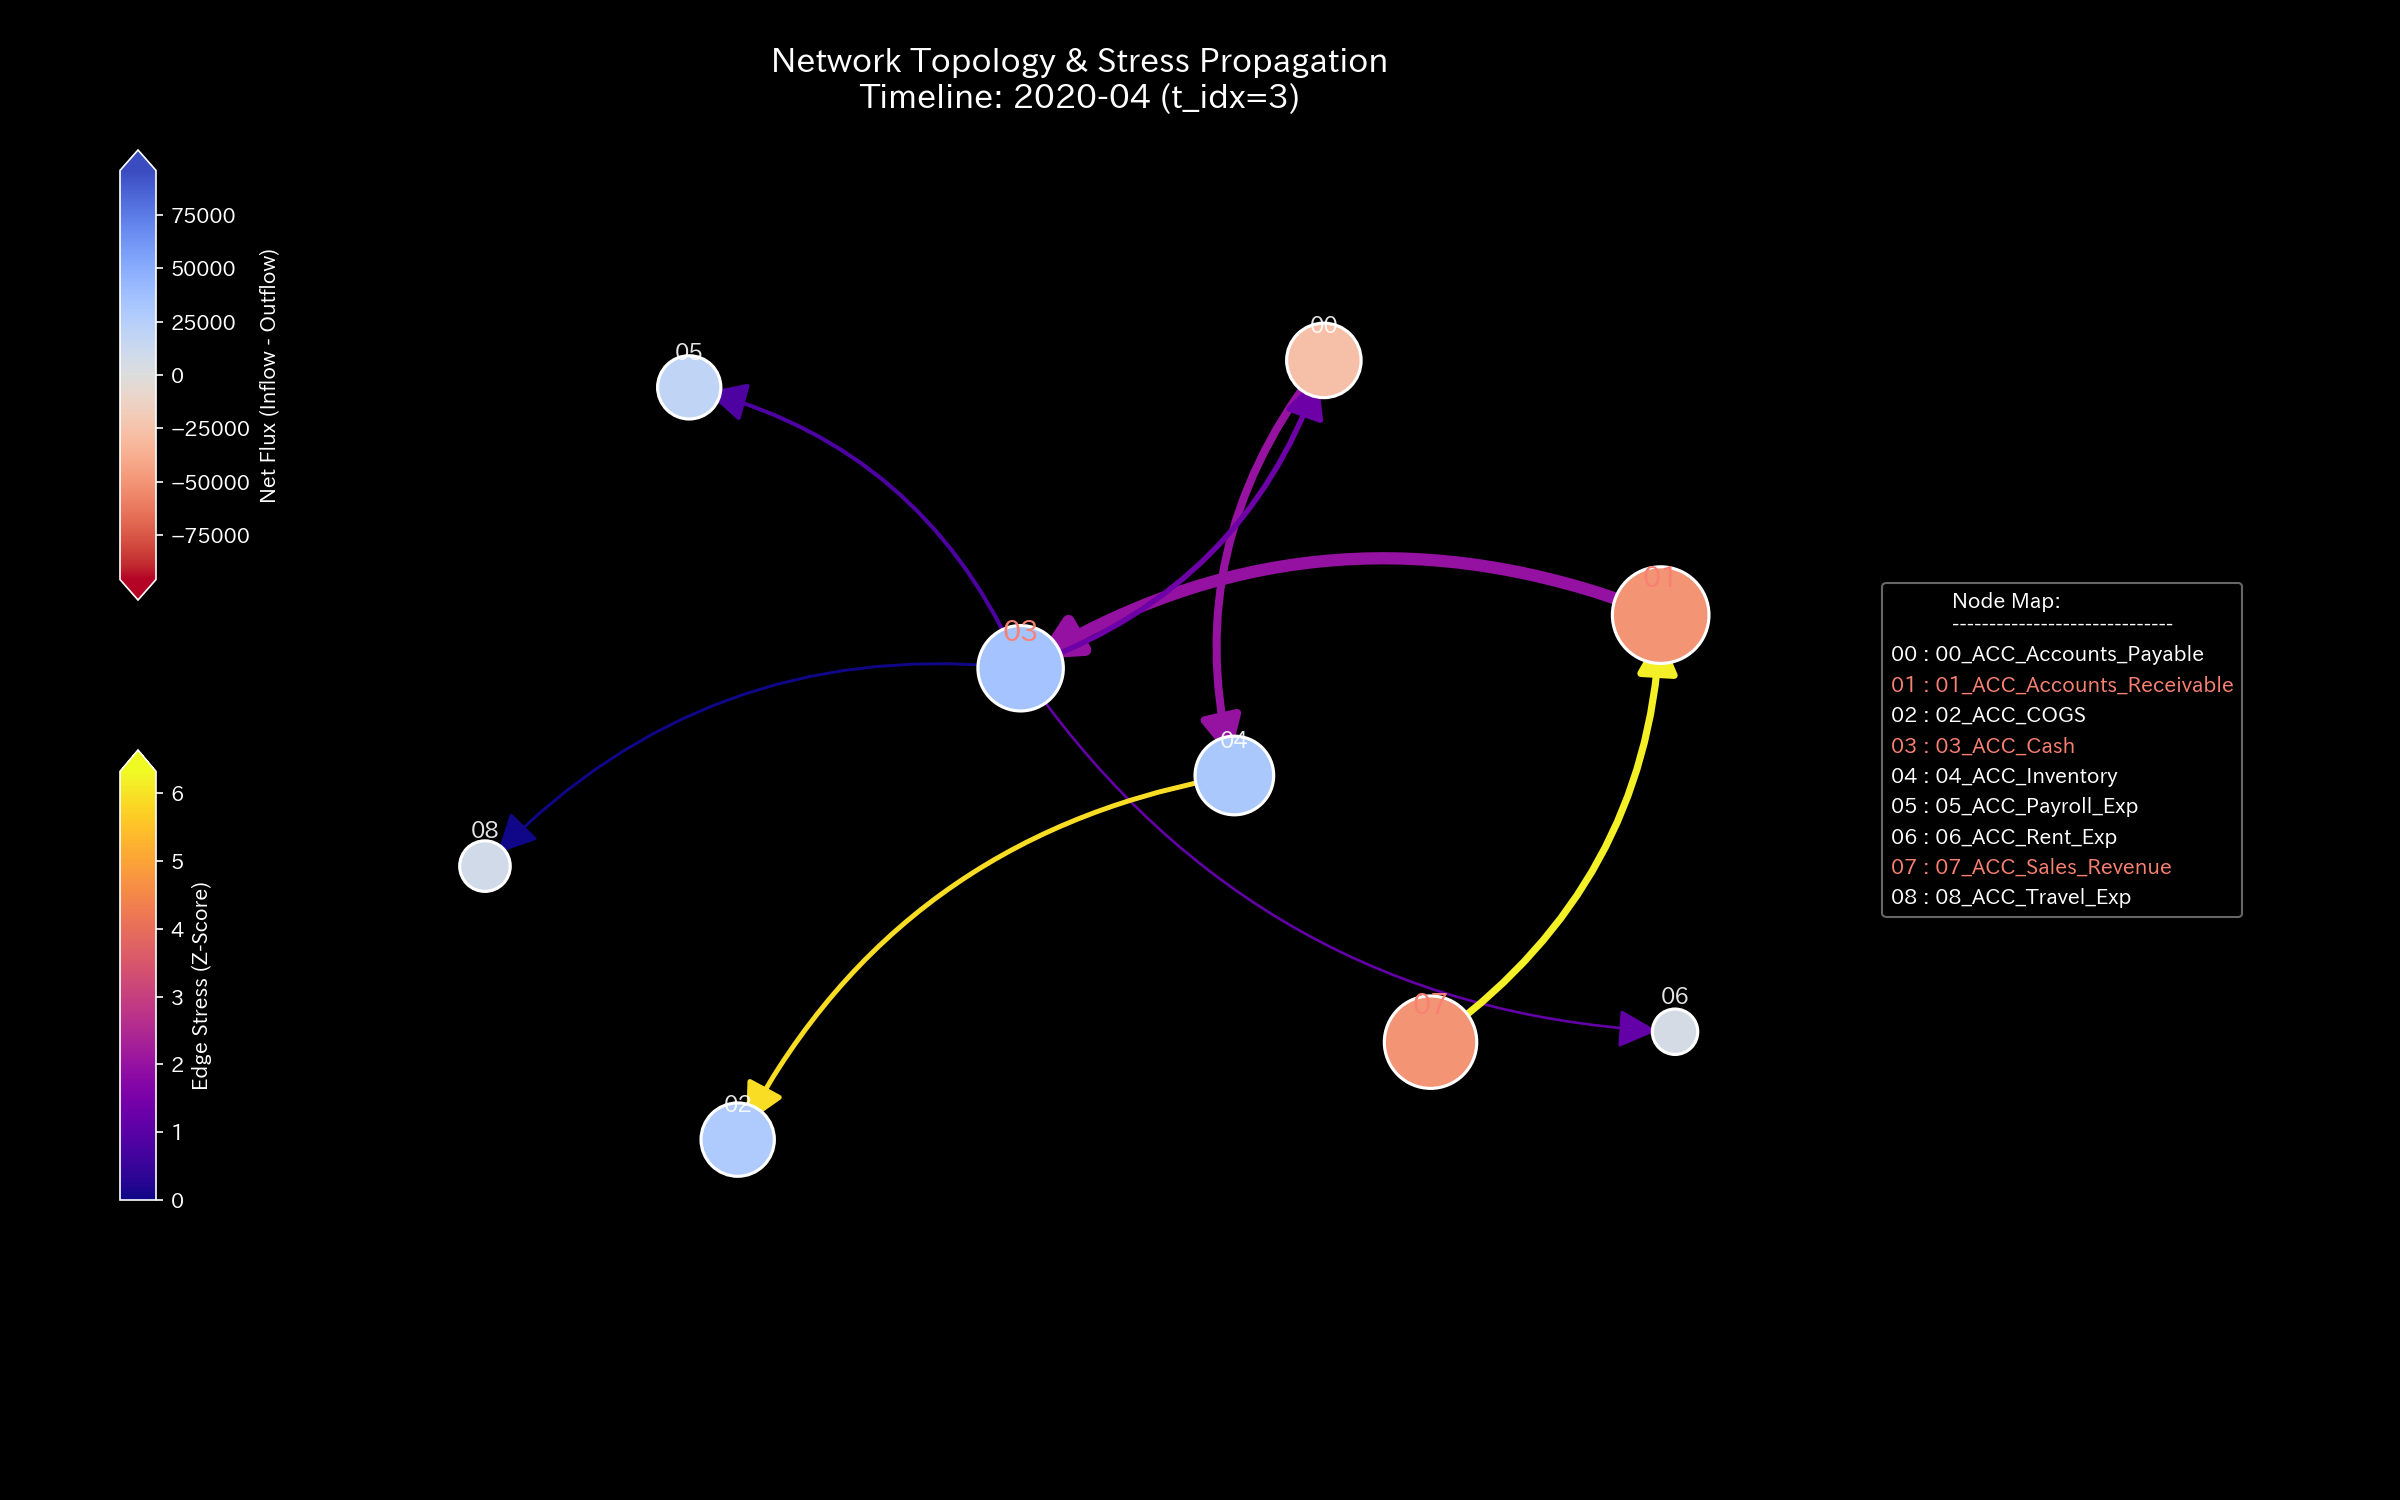
sheet. Assets above the line, liabilities and equity below. Nothing looks wrong.2. The same ledger as a flow network, April 2020. Node colour is net flow (blue in, red out);
arrow colour is stress, as a z-score. The two most stressed flows that month, in yellow, run from sales
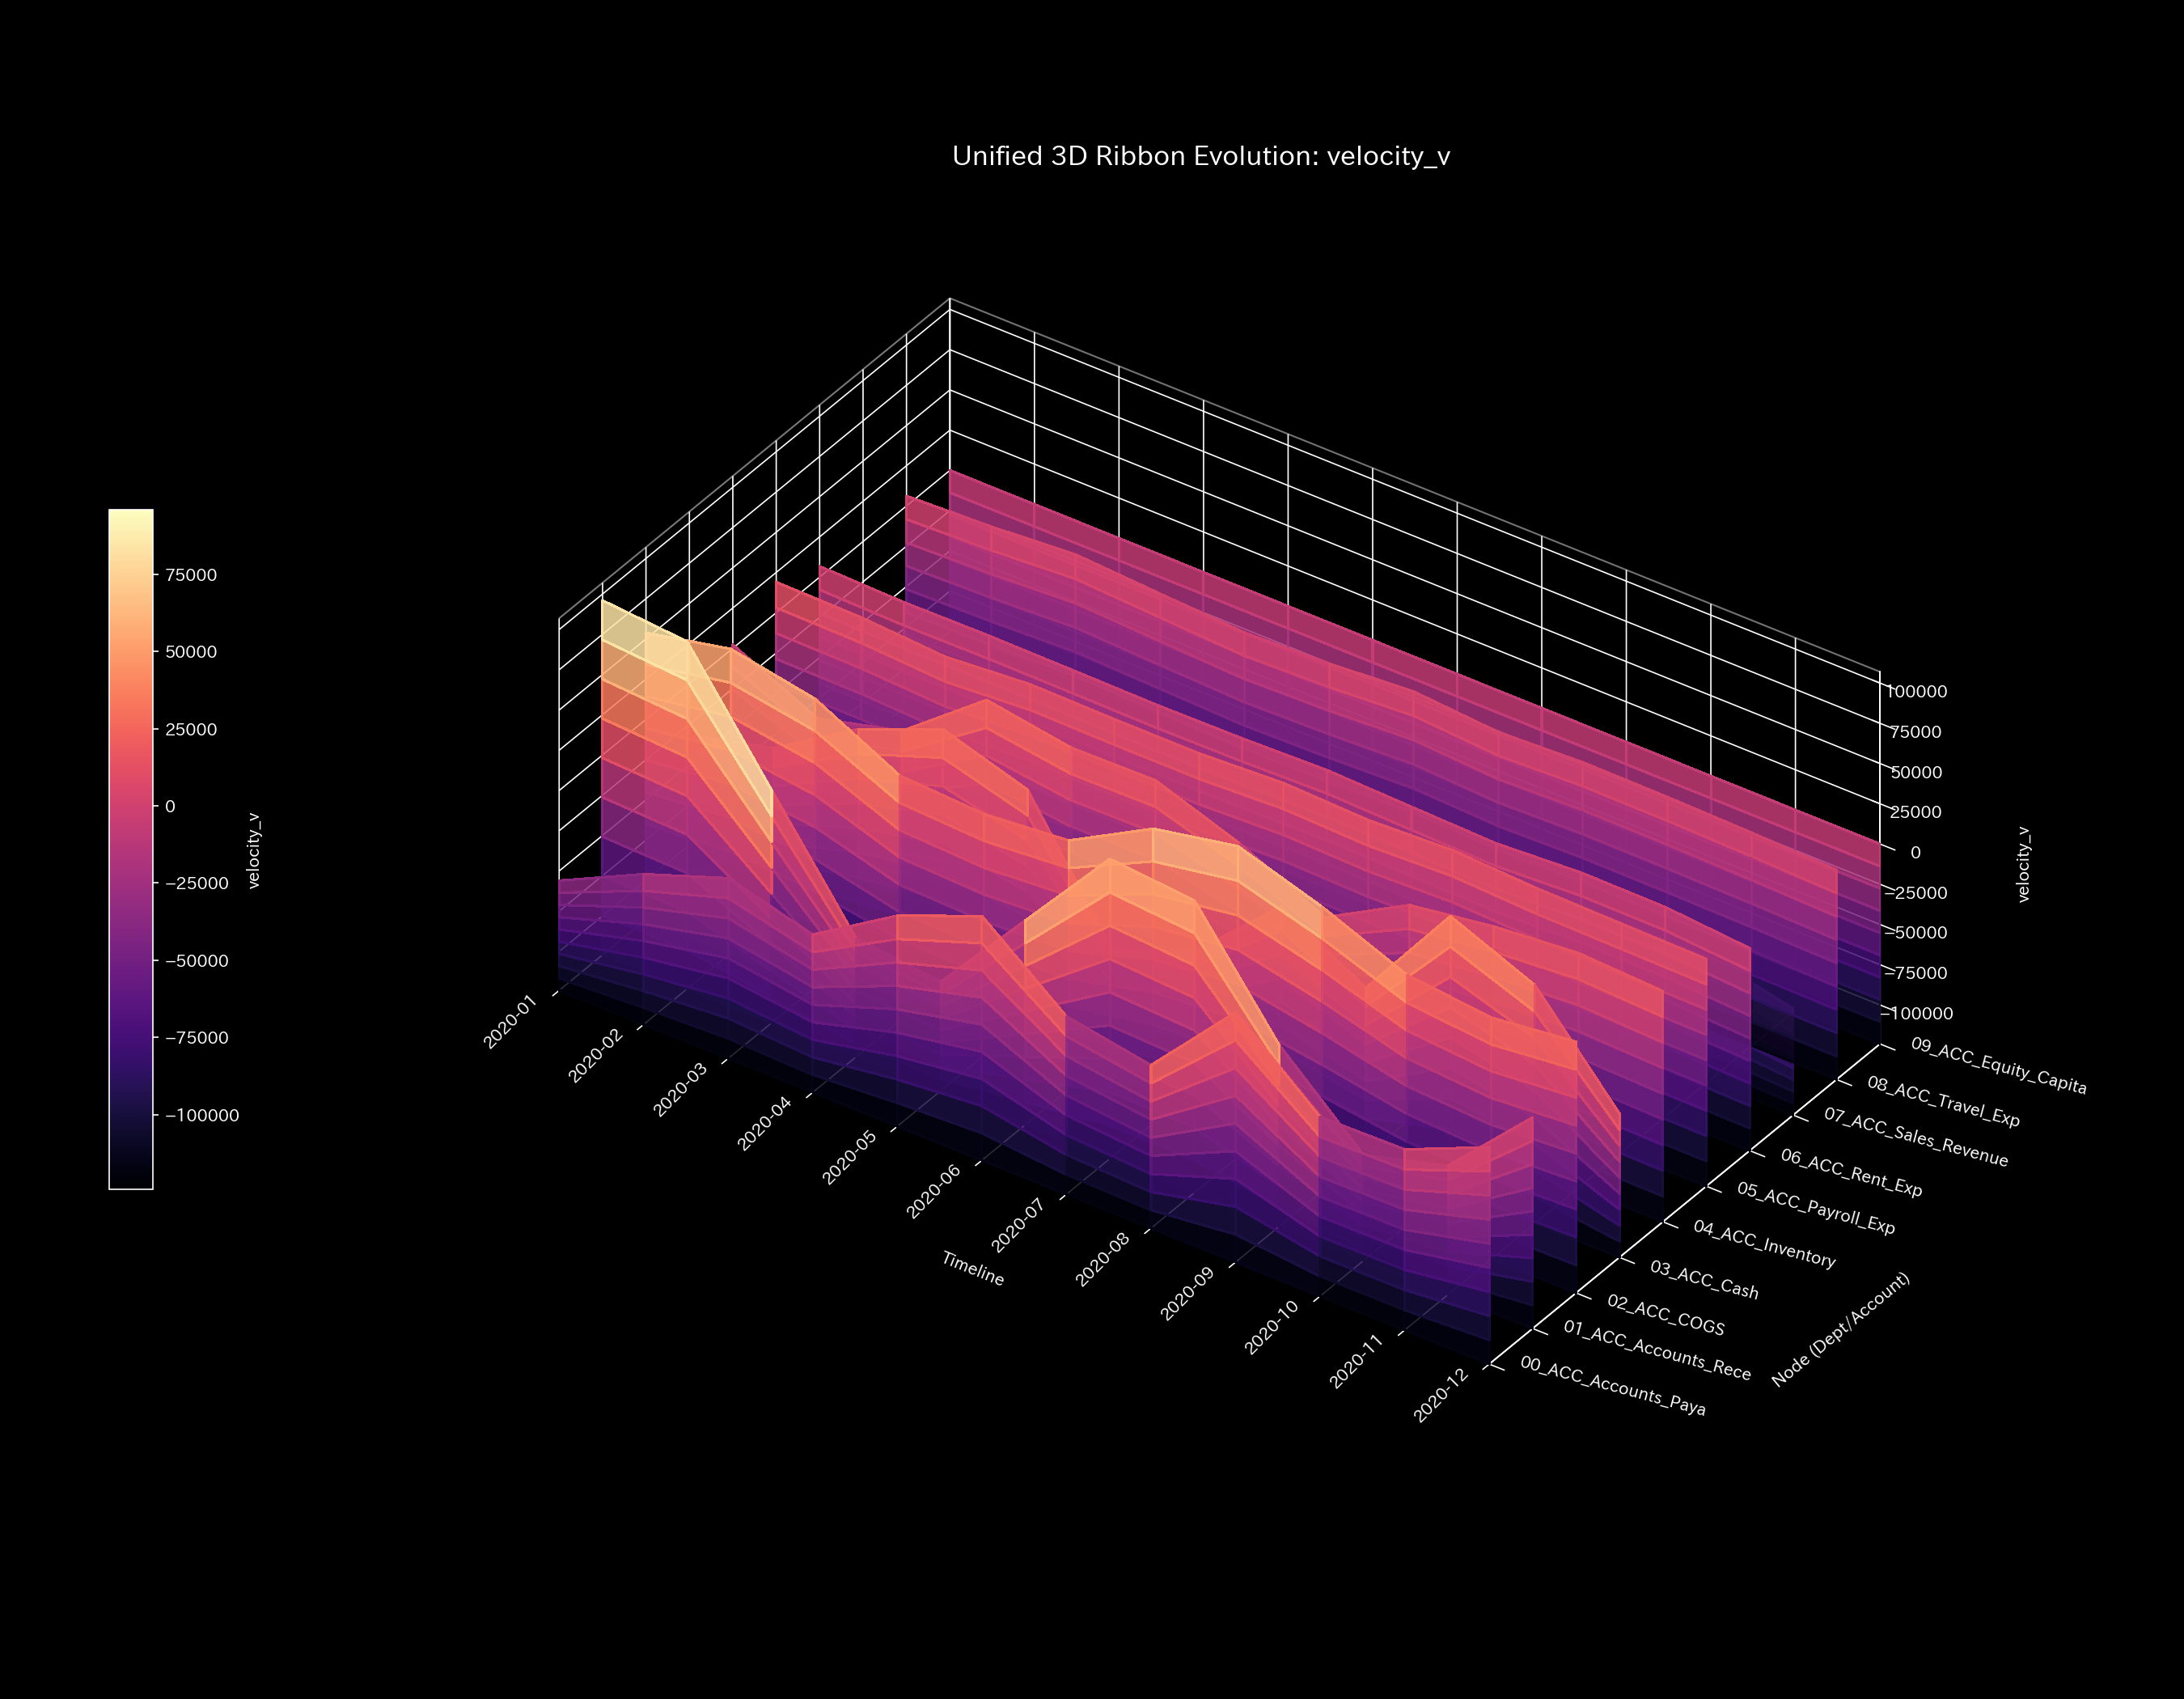
into receivables and from inventory into cost of goods sold.3. The same ledger over time. Each ribbon is one account; height is its velocity in the model,
positive for inflow and negative for outflow. Where the balance sheet looked steady, the flows through
several accounts swung sharply from month to month.
An open analysis platform that models a double-entry ledger as a mass-spring-damper network and flags
anomalies using quantities borrowed from classical mechanics and thermodynamics: entropy (how spread out or
concentrated the flow is), conservation residuals (whether what flows in matches what flows out), the
spectral radius of the transition matrix (how strongly a cycle feeds back on itself), and an energy-like
functional (a single number that rises when the system is under strain). The physical analogy is a
modelling choice, not a claim that ledgers obey physical law.
Validated so far only on synthetic cases: a model company's books, and test sets shaped like urban traffic,
order books, and brain-signal time series. Work on real data has not started. I have been in contact with
one researcher whose prior work overlaps with this.
It also ships a protocol that requires an LLM to test its own false positives and false negatives before
it reports anything. The code was written with AI coding agents under test-driven review; the design,
the tests, and the limits stated above are mine.
Python · Dockerised · test-driven · documented in Japanese and English · AGPL-3.0 ·
github.com/renpoo/TLU
Technical explainers, in two languages (2025–)
Written for business readers who are not engineers. Each piece starts from something on the reader's desk
— a spreadsheet that freezes, a payment that always runs late, a search that comes back empty — and works
backward to the structure underneath. The metaphors carry the explanation: streaming as noodles in a bamboo
flume, a bill of materials as a family tree, an organisation's strain as the joints of a robot arm. I
assume no vocabulary, and full intelligence.
I draft with a generative AI and keep the outline, the worked examples, and the checking of every claim for
myself; the English versions are machine-translated and post-edited by me. Pieces where the AI's share was
large say so at the top.
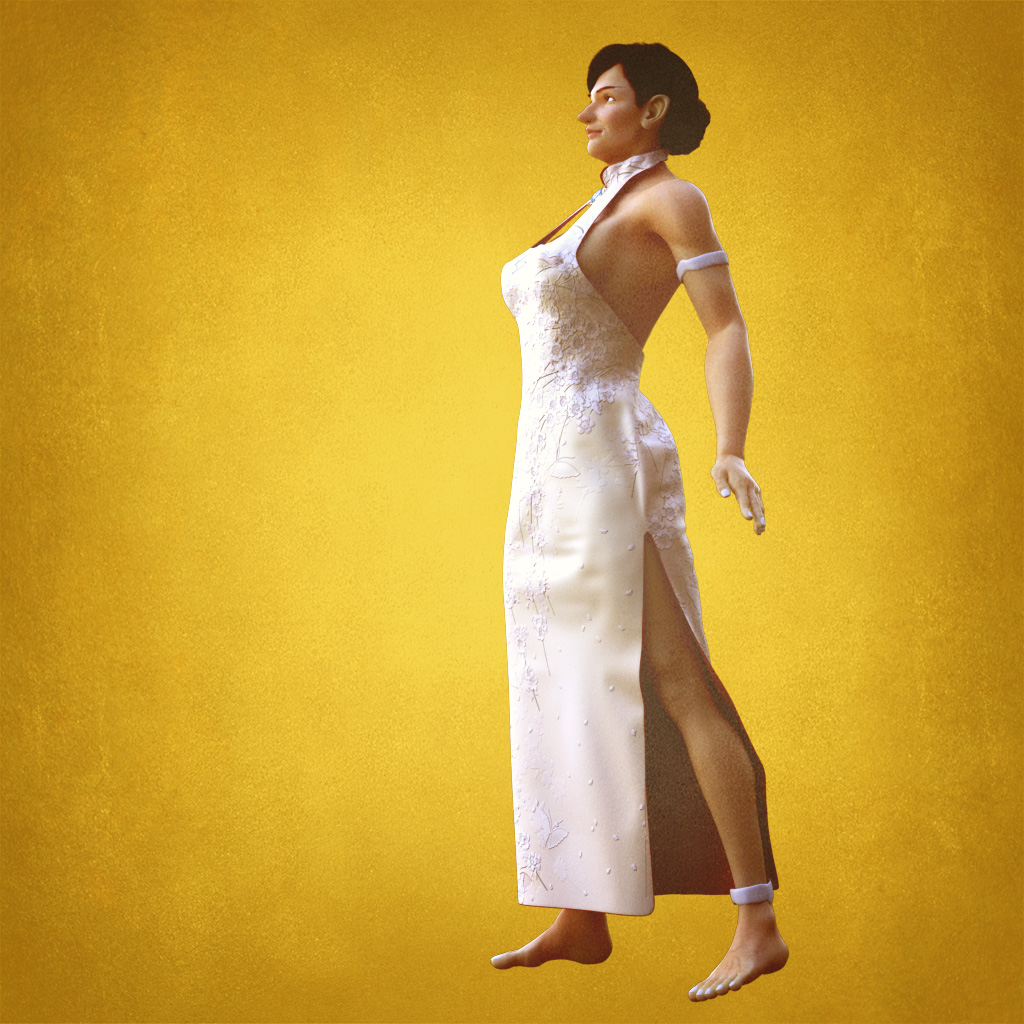
Miranda Ver.4, Maya Muscle rig, mid-stride. The deltoid and trapezius shift as the arm swings
back.
A muscle-rigged human maquette for Autodesk Maya, developed from 2004 and released under a Creative
Commons licence in 2013 (now CC BY 4.0). Re-engineered from a Maya Muscle system into a skinCluster +
Blendshape rig, halving the package from 525.9 MB to 265.3 MB while keeping muscle bulge and relaxation.
Both versions remain available for download; development stopped in 2019.
The trial set on Highend3D has been downloaded 42,406 times and rated 4.6 of 5 (as of October 2026). My
own server logs add an estimated 200,000 further downloads of the full package; that figure is mine, not
independently checkable.
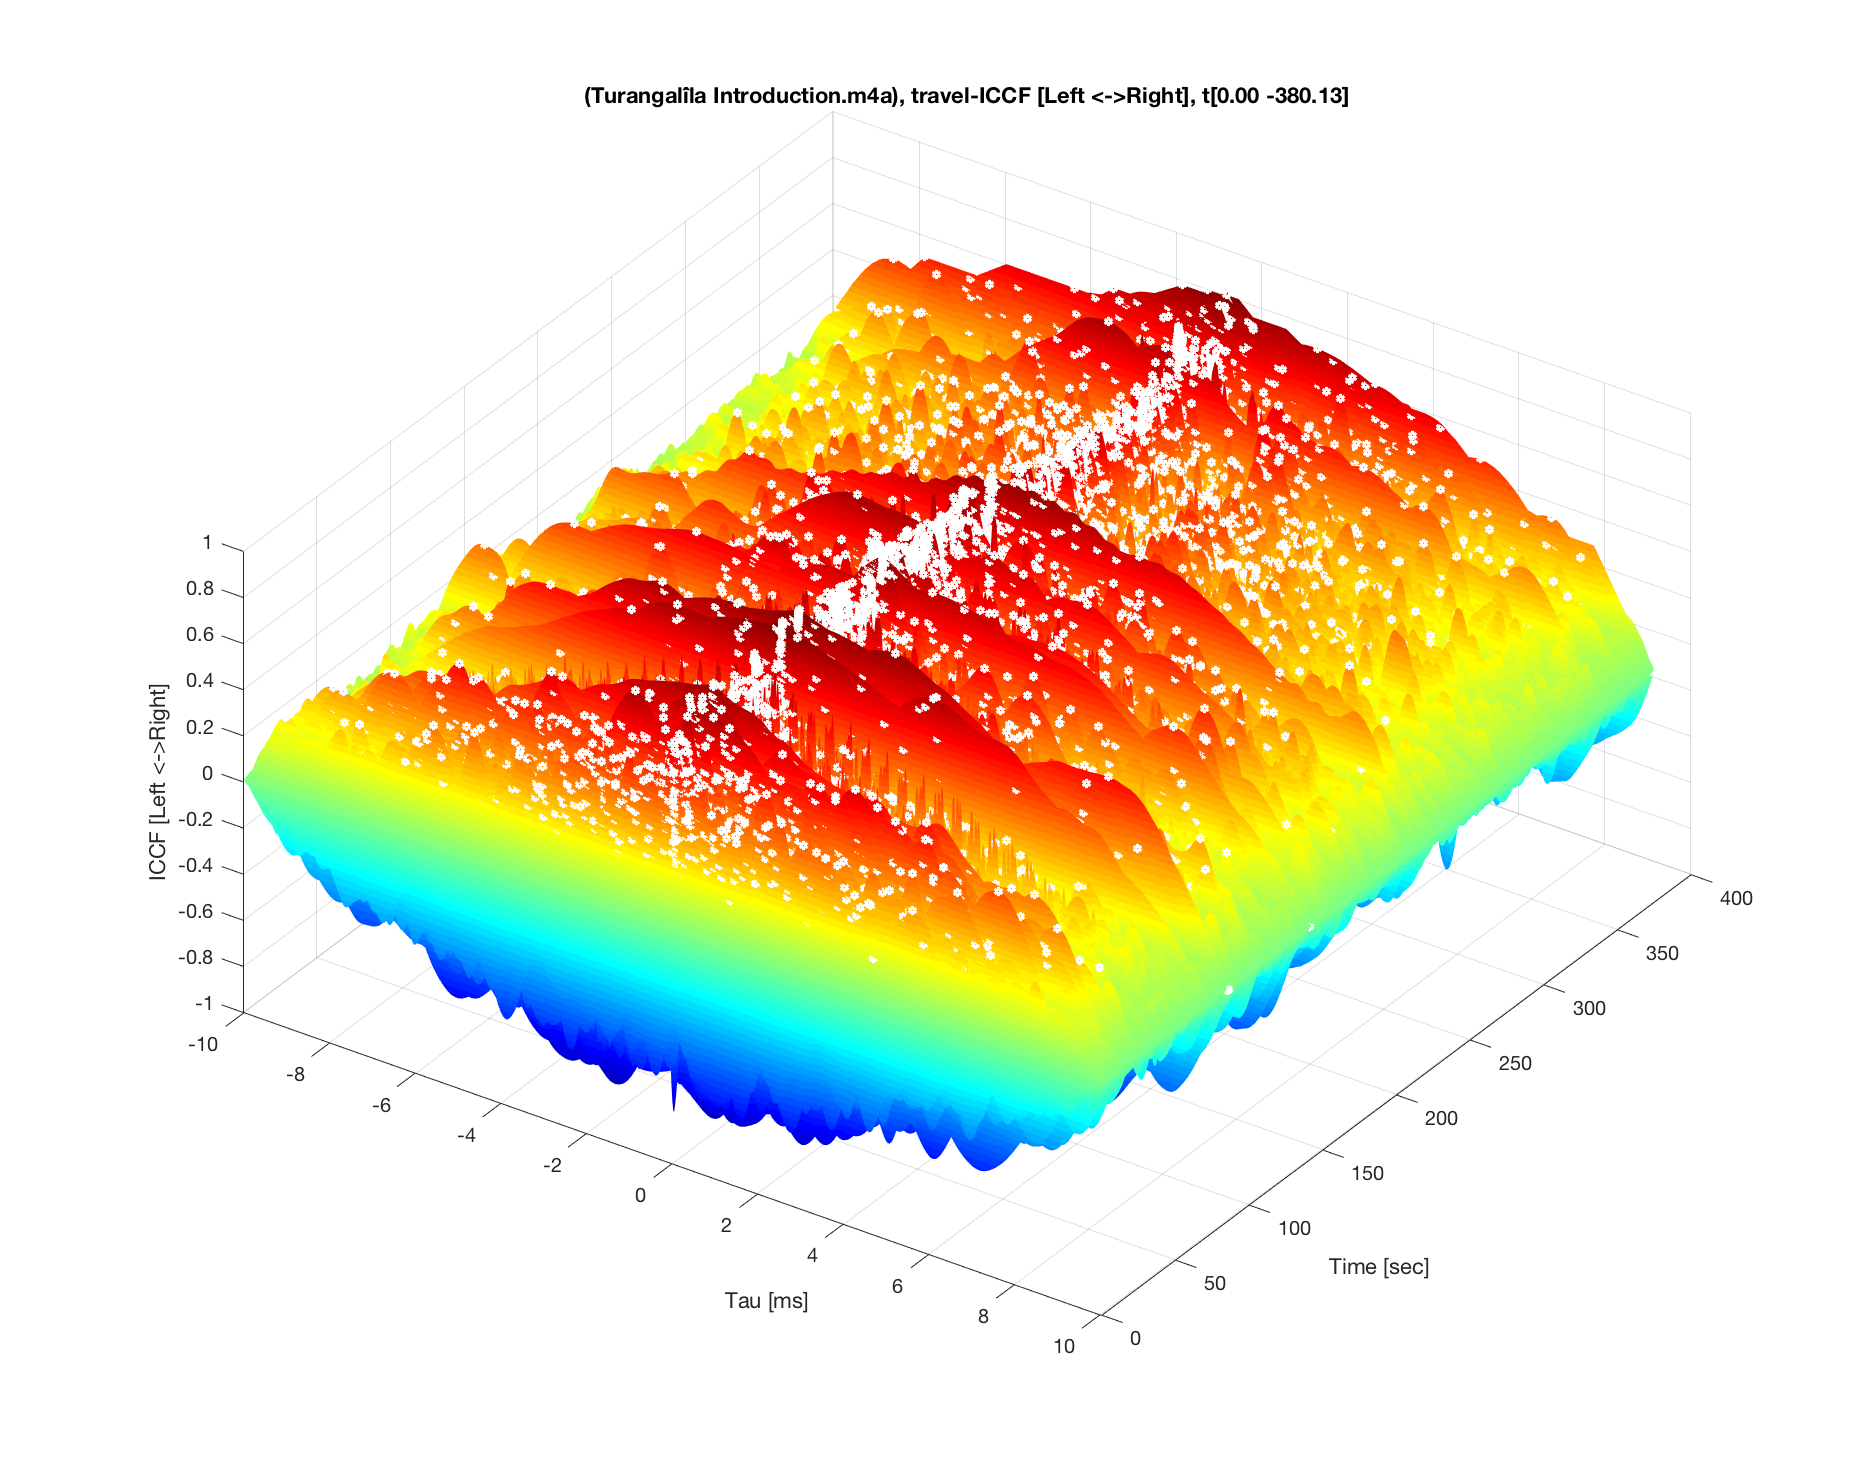
Six minutes of Messiaen’s Turangalîla, heard as terrain. Height is left–right
correlation; the white dots trace where the sound seems to come from, moment by moment.
A MATLAB tool that renders sound as correlation-function terrain. I built it as an unpaid collaborator
with Ken Ito’s group at the University of Tokyo (August 2014 to August 2016), to study concert-hall
acoustics. In one test it recovered 68 cm of a singer’s movement across the room from a stereo recording
alone.
Three conference papers came out of this work, each with me as first author and Ken Ito, Akinori Takei,
and Toru Toyoda as co-authors:
“A New Method of Analysis & Visualisation over the Cognitive Real/Virtual Space-Time Using
Correlation Function.” 22nd International Congress on Sound and Vibration (ICSV22), Florence, 12–16 July
2015, paper no. 734. Presented by Ken Ito.
“Sound Structure of Ancient Greek Harmonia Modes: Heterodyne Resonance and Differential Bases.”
7th International Symposium on Temporal Design in Architecture and Environment (ISTD-07), The University
of Tokyo, 24–25 November 2015, session M-2. Presented by me.
“Characteristic Effect for Proximal Narrow-band Digital Stochastic Noises” (“structural timbre”).
ISTD-07, session MM-5. Presented by me.
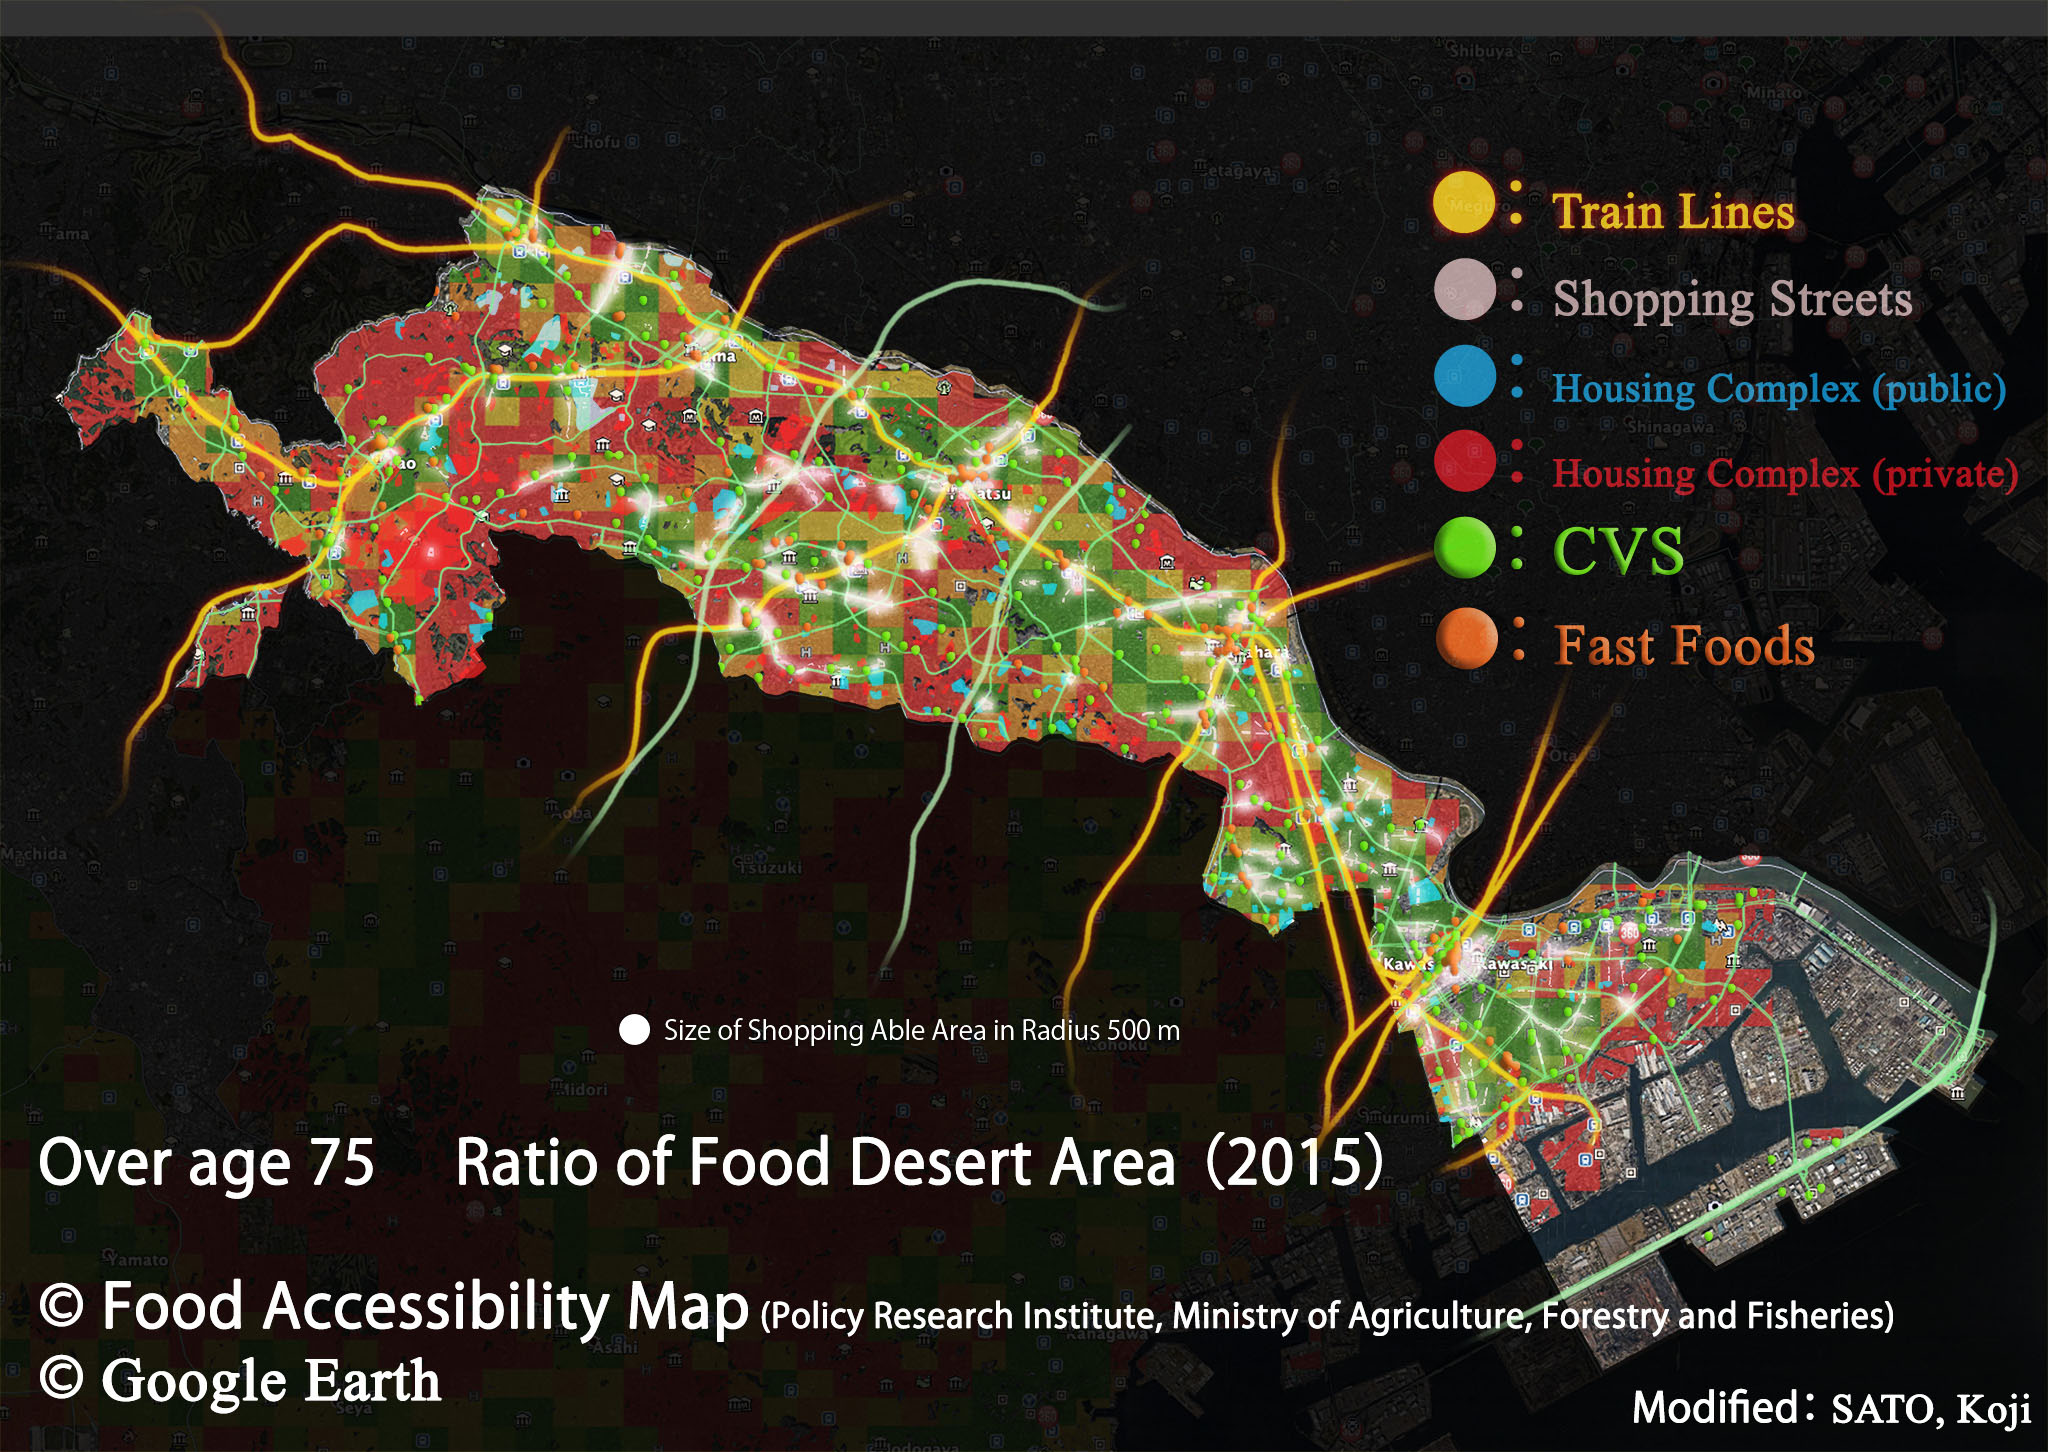
Food deserts for residents over 75, 2015. The red squares cluster in the hills to the north-west,
away from the train lines and the shopping streets that follow the valleys. Base data: the Ministry of
Agriculture, Forestry and Fisheries food-access map and Google Earth; layers composited by hand.
With the civic group Open Kawasaki, I overlaid elevation, housing-complex locations, shopping streets, rail
lines, and ageing-population statistics onto one map, to make the city’s food-desert problem visible where
spreadsheets could not.
Translation (2015–2021)
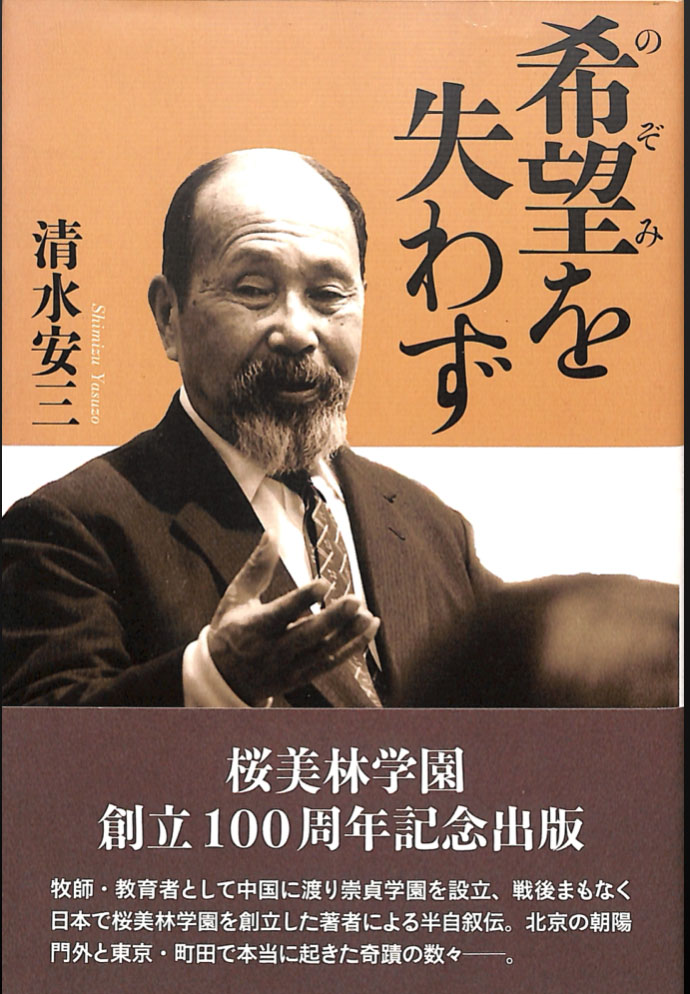
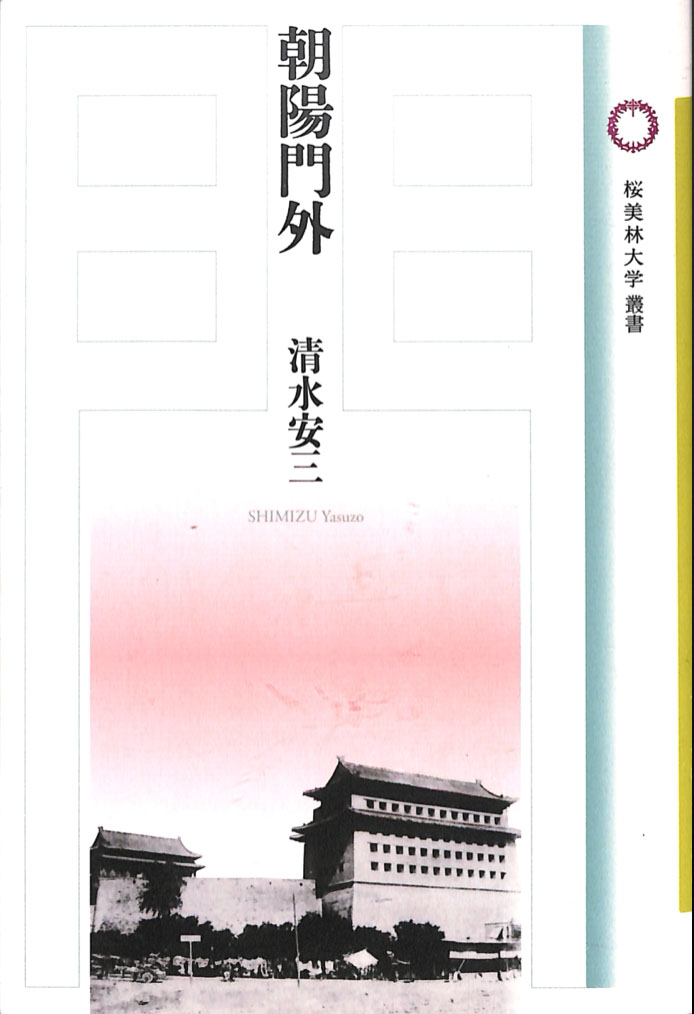
Two of the five volumes: Kibō o Ushinawazu (“Do Not Lose Hope”) and
Chōyōmongai (“Outside the Chaoyang Gate”). I produced the modern-Japanese text for both; the
published editions carry no translator credit.
Six years rendering five books by Yasuzo Shimizu, founder of J.F. Oberlin University (Japan), from Meiji-era
Japanese, Kanbun, and classical Japanese into plain modern Japanese prose. 659 reference materials, from the
Edo to the Shōwa era, digitised and checked against the text; the manuscript version-controlled in Git.
Two volumes published, three delivered.
Credits other people wrote
Credited as CGI Assistant: Koji Sato on “Keizan Musouzu (A Reverie in the Mountains)”,
NHK, selected for the ACM SIGGRAPH ’97 Electronic Theater —
ACM
SIGGRAPH History Archive.
Award for the Outstanding Paper by Student, 7th International Symposium on Temporal Design (Tokyo, 2015),
for “Sound Structure of Ancient Greek Harmonia Modes: Heterodyne Resonance and Differential Bases”.
Certificate available on request.
Named as the builder of the acoustic analysis system whose figures appear in Ken Ito, “Chōnōryoku!
(Extra Listening Perception!)”, Chikuma Shinsho, 2015.
Acknowledged in Mukai, T., “Example-based Helper Bone Rig Construction for Linear Blend Skinning,” IPSJ
Journal 56(11), 2015 — winner of the IPSJ Best Paper Award 2016 — for providing the character model and
advising on its use. (Credited as 大蘇 蓮風 / Renpoo Taiso.)